
Characteristics influencing Nicotine Usage
nicotine
substance abuse
modeling
Introduction
- Nicotine usage associated with cancer and heart disease
- Only about 3% of smokers quit nicotine usage successfully each year Methods Diagnostics
- Personality tendencies often linked to drug usage
- Survey data of demographics, personality scores, and drug history from 1885 participants
Project Goal: Investigate the relationship between individual personality and demographic characteristics and nicotine usage status
Multinomial logistic regression
If we have more than two categories or groups that we want to model relative to covariates (e.g., we have observations \(i = 1,\cdots,n\) and groups covariates \(j = 1,\cdots,J\)), multinomial is our candidate model
Let
- \(p_{ij}\) be the probability that the i-th observation belongs to the j-th group
- \(Y_{ij}\) be the number of observations for individual i in group j; An individual will have observations \(Y_{i1},Y_{i2},…Y_{iJ}\)
- assume the probability of observing this response is given by a multinomial distribution in terms of probabilities \(p_{ij}\), where \(\sum_{j = 1}^J p_{ij} = 1\) . For interpretation, we have a baseline category \(p_{i1} = 1 - \sum_{j = 2}^J p_{ij}\)
The link between the mean response (probability) \(p_{ij}\) and a linear function of the covariates
\[ \eta_{ij} = \mathbf{x'_i \beta_j} \]
which equals
\[\log \frac{p_{ij}}{p_{i1}}, j = 2,..,J \]
We compare \(p_{ij}\) to the baseline \(p_{i1}\), suggesting
\[ p_{ij} = \frac{\exp(\eta_{ij})}{1 + \sum_{i=2}^J \exp(\eta_{ij})} \]
which is known as multinomial logistic model.
Note:
- Softmax coding for multinomial logistic regression: rather than selecting a baseline class, we treat all K class symmetrically - equally important (no baseline).
\[ P(Y = k | X = x) = \frac{exp(\beta_{k1} + \dots + \beta_{k_p x_p})}{\sum_{l = 1}^K exp(\beta_{l0} + \dots + \beta_{l_p x_p})} \] then the log odds ratio between \(k-th\) and \(k^{t}th\) classes is
\[ \log (\frac{P(Y=k|X=x)}{P(Y = k' | X=x)}) = (\beta_{k0} - \beta_{k'0}) + \dots + (\beta_{kp} - \beta_{k'p}) x_p \]
Explanatory data analysis
Distribution of Nicotine usage by Gender

Comments
- the largest proportion of recent users were man
Distribution of nicotine usage by education
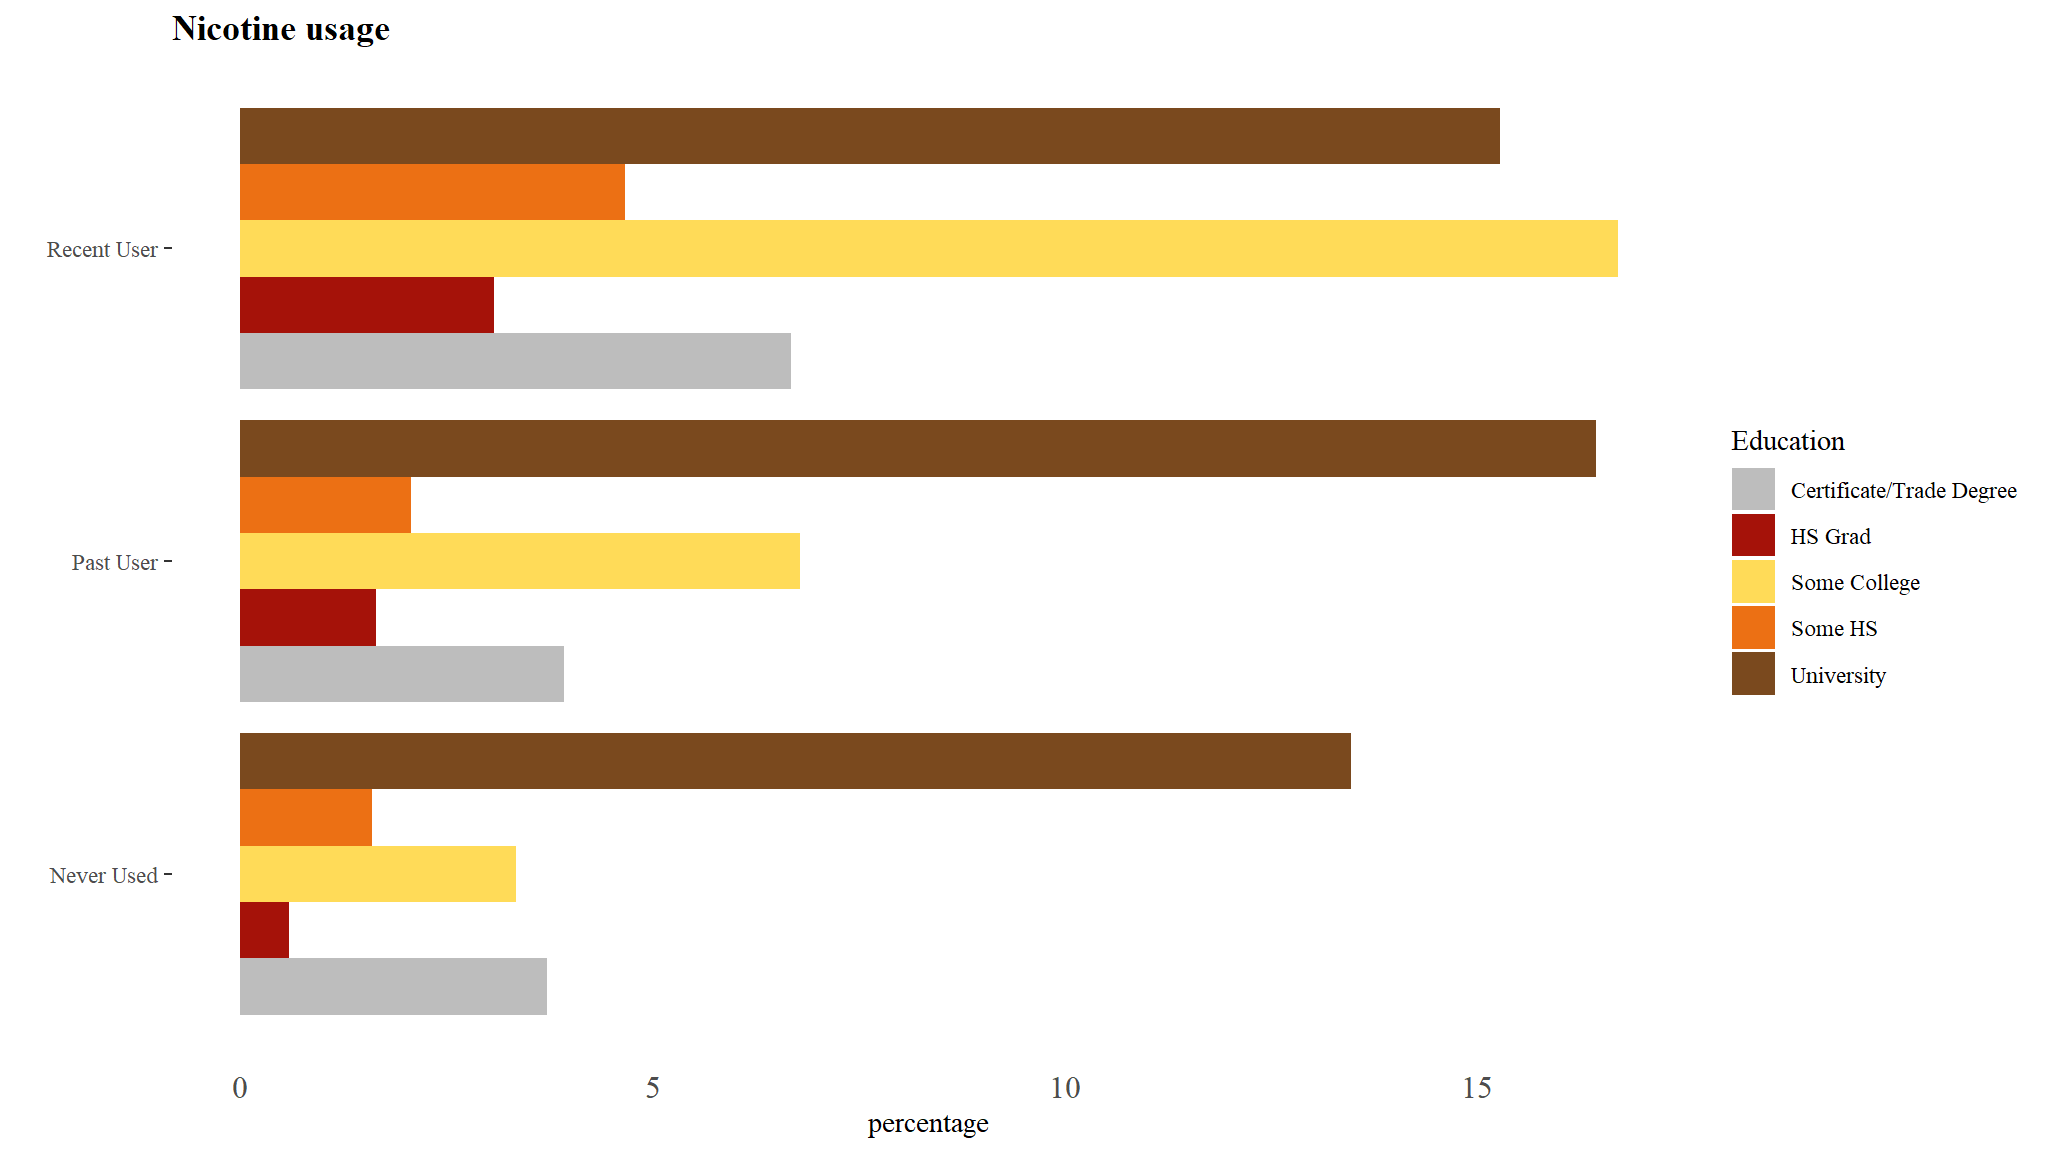
Comments
- University students constitute the greatest percentage of both past and current users
- Vocational colleges/ some colleges also constitute the greatest percentage of recent users
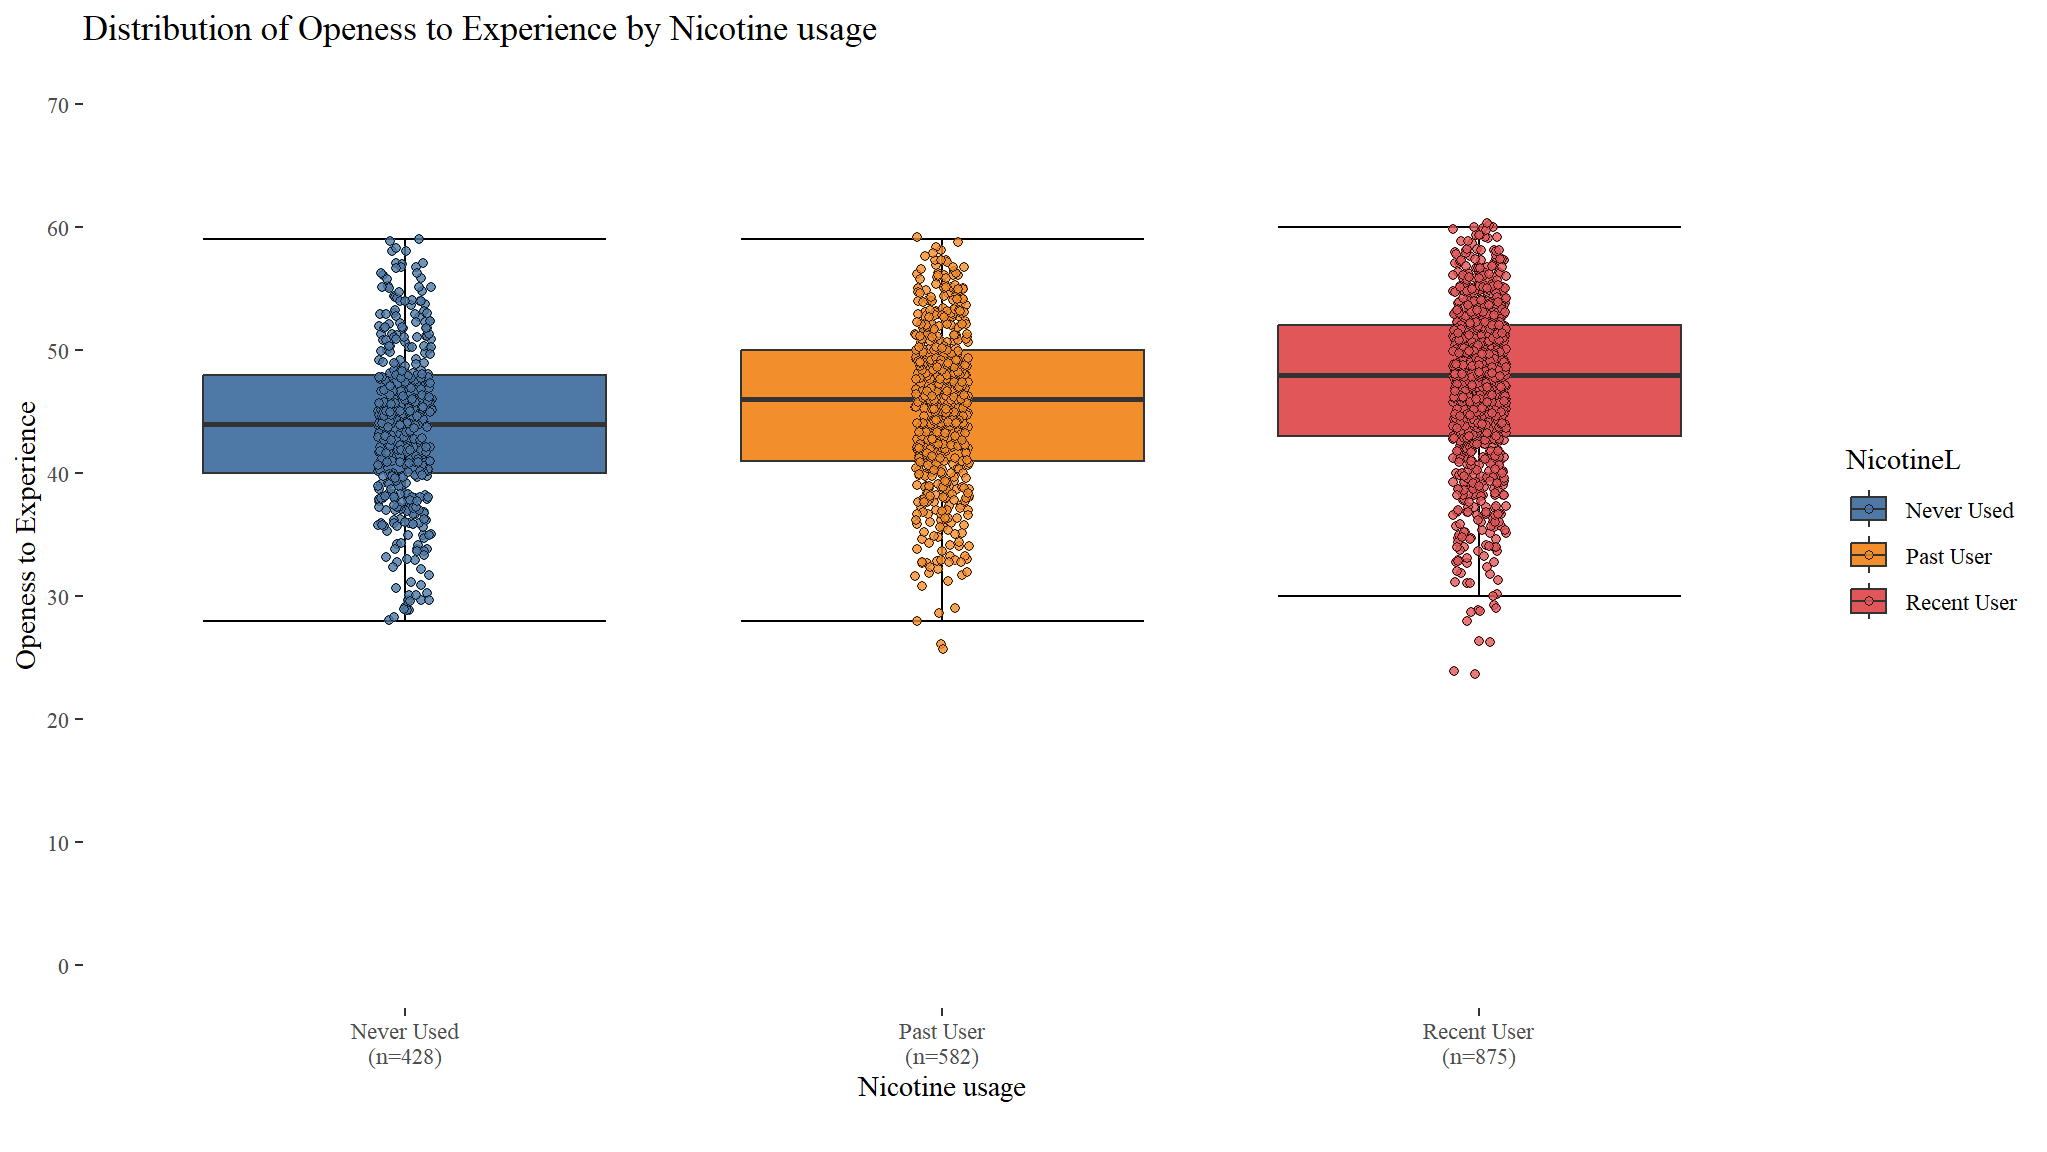
Distribution of Openess to Experience by Nicotine usage
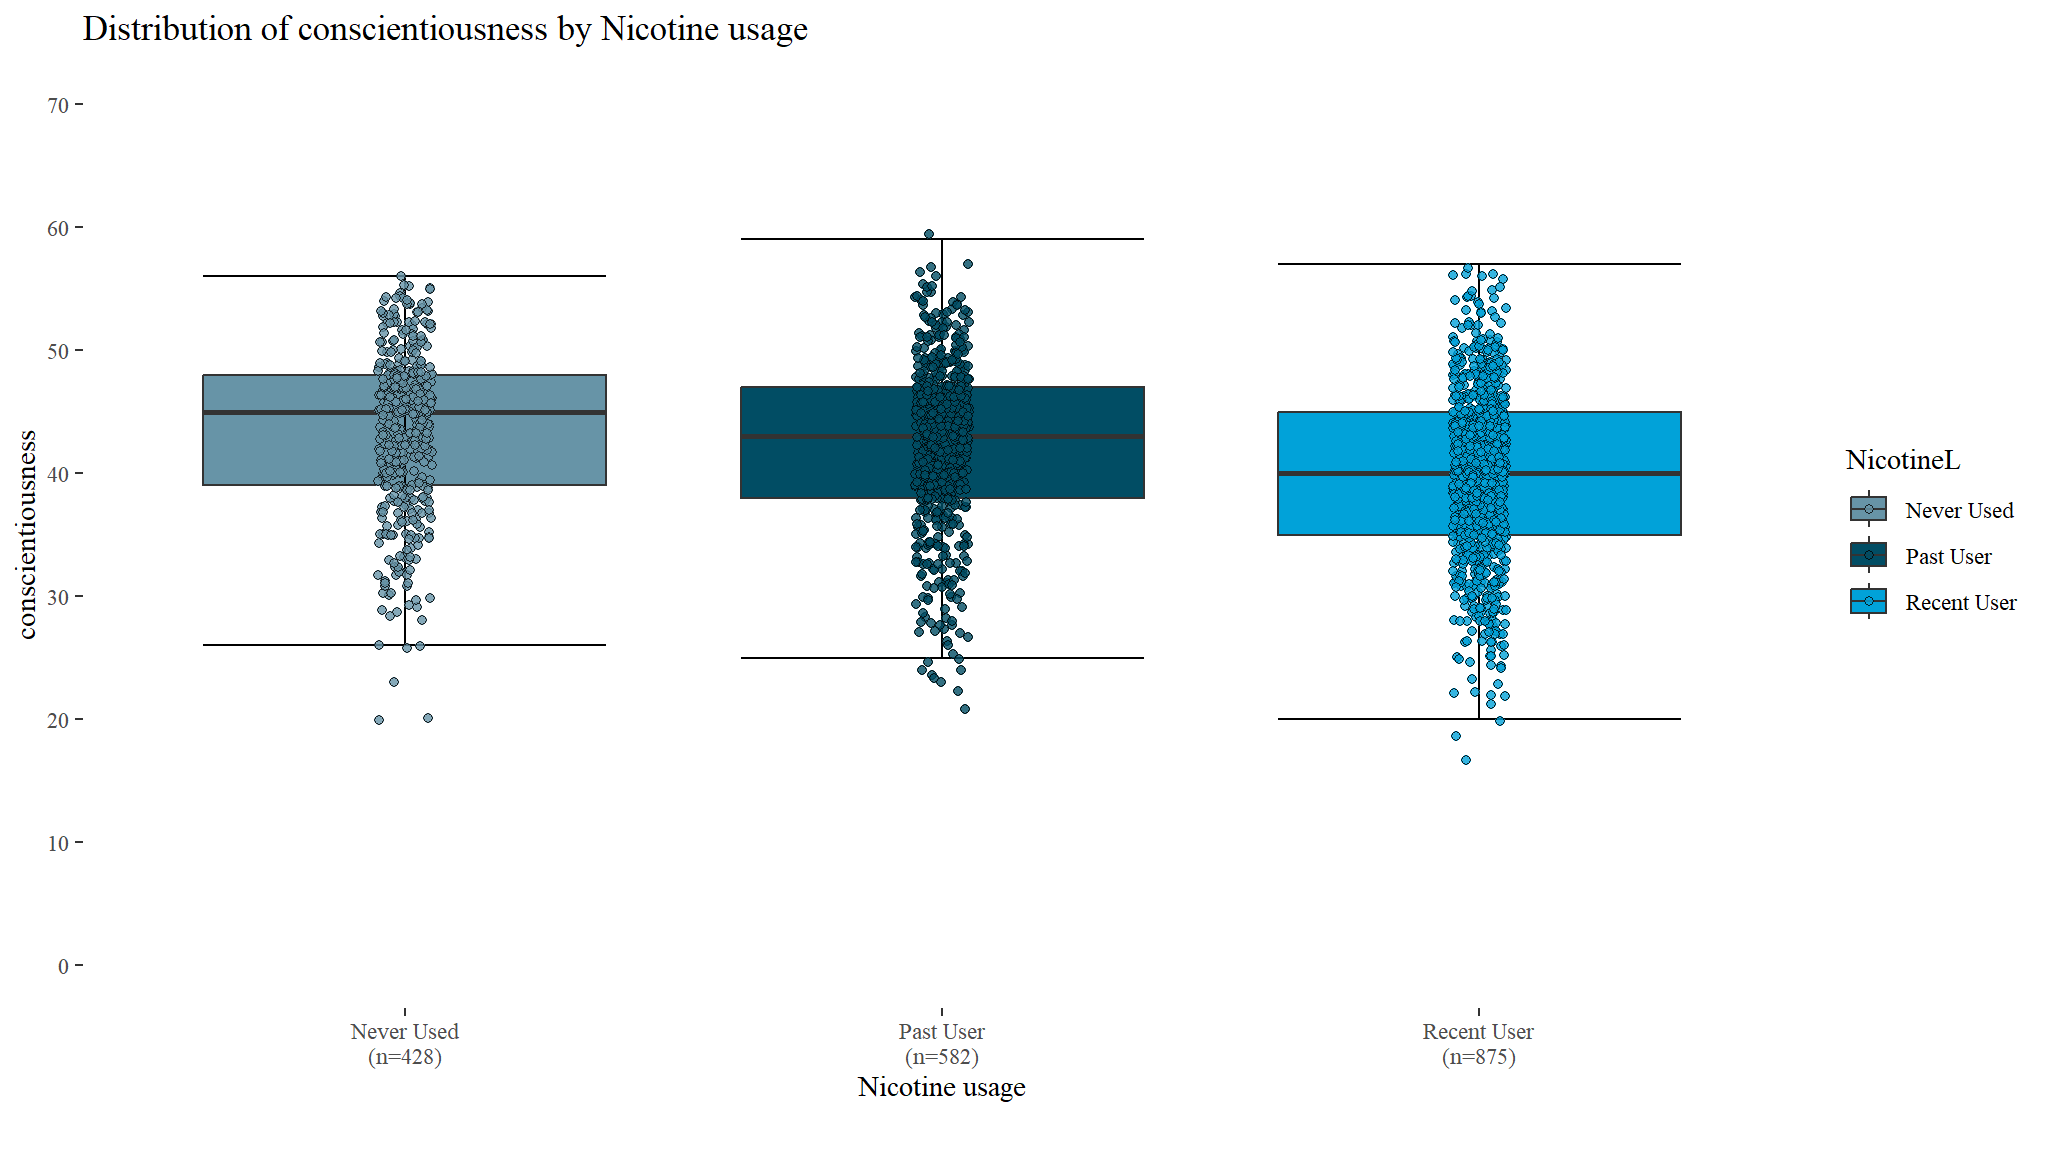
Distribution of conscientiousness by Nicotine usage
Associations and Analysis of variance
| Characteristic | N | Overall, N = 18851 | Never Used, N = 4281 | Past User, N = 5821 | Recent User, N = 8751 | Test Statistic | p-value2 |
|---|---|---|---|---|---|---|---|
| Gender | 1885 | 67.88890 | <0.001 | ||||
| Female | 50%(942/1885) | 64%(275/428) | 53%(311/582) | 41%(356/875) | |||
| Male | 50%(943/1885) | 36%(153/428) | 47%(271/582) | 59%(519/875) | |||
| Education | 1885 | 129.50631 | <0.001 | ||||
| Certificate/Trade Degree | 14%(270/1885) | 16%(70/428) | 13%(74/582) | 14%(126/875) | |||
| HS Grad | 5.3%(100/1885) | 2.6%(11/428) | 5.3%(31/582) | 6.6%(58/875) | |||
| Some College | 27%(506/1885) | 15%(63/428) | 22%(128/582) | 36%(315/875) | |||
| Some HS | 8.3%(157/1885) | 7.0%(30/428) | 6.7%(39/582) | 10%(88/875) | |||
| University | 45%(852/1885) | 59%(254/428) | 53%(310/582) | 33%(288/875) | |||
| Oscore | 1885 | 46(7) | 44(6) | 45(6) | 47(7) | 37.54855 | <0.001 |
| Cscore | 1885 | 41(7) | 43(7) | 42(7) | 40(7) | 49.00904 | <0.001 |
| Impulsive | 1885 | 255(77) | 271(69) | 266(72) | 240(80) | 33.37276 | <0.001 |
| 1 %(n/N); Mean(SD) | |||||||
| 2 Pearson’s Chi-squared test; One-way ANOVA | |||||||
Comments
- pleminary results from the chi-square test at 5% level of significance suggest that there is significant association between gender and nicotine usage (p<0.001)
- results also suggest a significant association between education and Nicotine usage
- Analysis of variance also suggest and significant different in mean
conscientiousnessbetween the different nicotine users (p<0.001) - Average
Openess to Experienceis also significantly different between the types ofNicotineusers and so ismean impulsiveness
Fit the model
#> # weights:  30 (18 variable)
#> initial  value 2070.884164
#> iter  10 value 1900.712626
#> iter  20 value 1846.620744
#> final  value 1846.529384
#> converged| Characteristic | Past User | Recent User | ||||
|---|---|---|---|---|---|---|
| OR1 | 95% CI1 | p-value | OR1 | 95% CI1 | p-value | |
| Gender | ||||||
| Female | — | — | — | — | ||
| Male | 1.35 | 1.04, 1.77 | 0.025 | 1.75 | 1.35, 2.26 | <0.001 |
| Education | ||||||
| Certificate/Trade Degree | — | — | — | — | ||
| HS Grad | 2.52 | 1.17, 5.45 | 0.018 | 2.36 | 1.13, 4.95 | 0.022 |
| Some College | 1.52 | 0.96, 2.40 | 0.073 | 1.67 | 1.09, 2.55 | 0.018 |
| Some HS | 1.26 | 0.70, 2.25 | 0.4 | 1.72 | 1.01, 2.92 | 0.045 |
| University | 1.09 | 0.75, 1.58 | 0.7 | 0.61 | 0.42, 0.87 | 0.006 |
| Oscore | 1.04 | 1.02, 1.06 | <0.001 | 1.07 | 1.05, 1.09 | <0.001 |
| Cscore | 0.98 | 0.96, 1.00 | 0.13 | 0.95 | 0.93, 0.97 | <0.001 |
| Impulsive | 1.00 | 1.00, 1.00 | >0.9 | 1.00 | 1.00, 1.00 | 0.001 |
| 1 OR = Odds Ratio, CI = Confidence Interval | ||||||
Conclusion
Comment
All else being equal, Men have a
35%increased chance of belonging to Past User group relative to the group that has never used, and a75%increased chance of belonging to the Recent User relative to the group that never used.Higher Openness Scores and lower Conscientious scores associated with Past and Recent User status
Education predictor less significant in Past User model, overall, those without university education had higher probability of being Recent of Past Users
The end